Professional Matplotlib Figures for LaTeX
🔠 Font
Font Style
To ensure that the fonts in matplotlib figures exactly match those in the LaTeX document, the best practice is to use LaTeX for font rendering. This guarantees 100% font consistency.
-
Install TeX Live on your system (
brew install texliveon macOS,apt install texlive-fullon Debian or Ubuntu; for Windows, see this guide ). After installation, make sure the pdflatex executable is available in your PATH. -
Use
LaTeXfor font rendering:
import matplotlib.pyplot as plt
plt.rcParams.update({
    "text.usetex": True,
    "font.family": "Computer Modern",
})
- Prefer using LaTeX’s overpic to add text annotations to figures whenever possible.
As a general rule, avoid embedding non-essential text directly in Matplotlib figures. Instead, delegate text annotations to LaTeX, where they can fully participate in the document’s typography, referencing, and layout system.
Concretely, rather than inserting a figure as:
\begin{figure}
  \centering
  \includegraphics[width=1.0\linewidth]{example.pdf}
\end{figure}
use the overpic environment to overlay text:
\begin{figure}
  \centering
  \begin{overpic}[width=1.0\linewidth]{example.pdf}
    \put(X, Y){Example text}
  \end{overpic}
\end{figure}
Here, \put(X, Y){...} places the annotation at position (X, Y) in percentage-based coordinates relative to the figure,
where X and Y range from 0 to 100.
The content inside the braces can be any valid LaTeX material, including:
- mathematical expressions,
- cross-references (e.g., \ref, \cref),
- citations (\cite),
- or custom macros defined in the document.
This approach ensures that all textual elements in the figure are rendered using the same font, size, and styling as the LaTeX body, while also greatly simplifying later edits and global formatting adjustments.
Font size
Using a font size consistent with the main LaTeX document is essential for a professional appearance. Although this is conceptually simple, many people struggle to adjust the font sizes of elements such as legends, tick labels, and figure titles.
The key point is that font size is relative to the figure size. If a figure is created at an overly large size, the text will appear small once the figure is inserted into the document, even if large font values are used.
Therefore, the first and most important step in font-size control is to set the figure size correctly. The guiding principle is straightforward: make the figure width identical to its final width in the document.
As illustrated in the figure below, for a single-column figure in an IEEE double-column layout, the column width is approximately 3.5 inches. Simply set the figure width to 3.5 inches, and the font sizes will naturally align with the LaTeX document without further tuning.
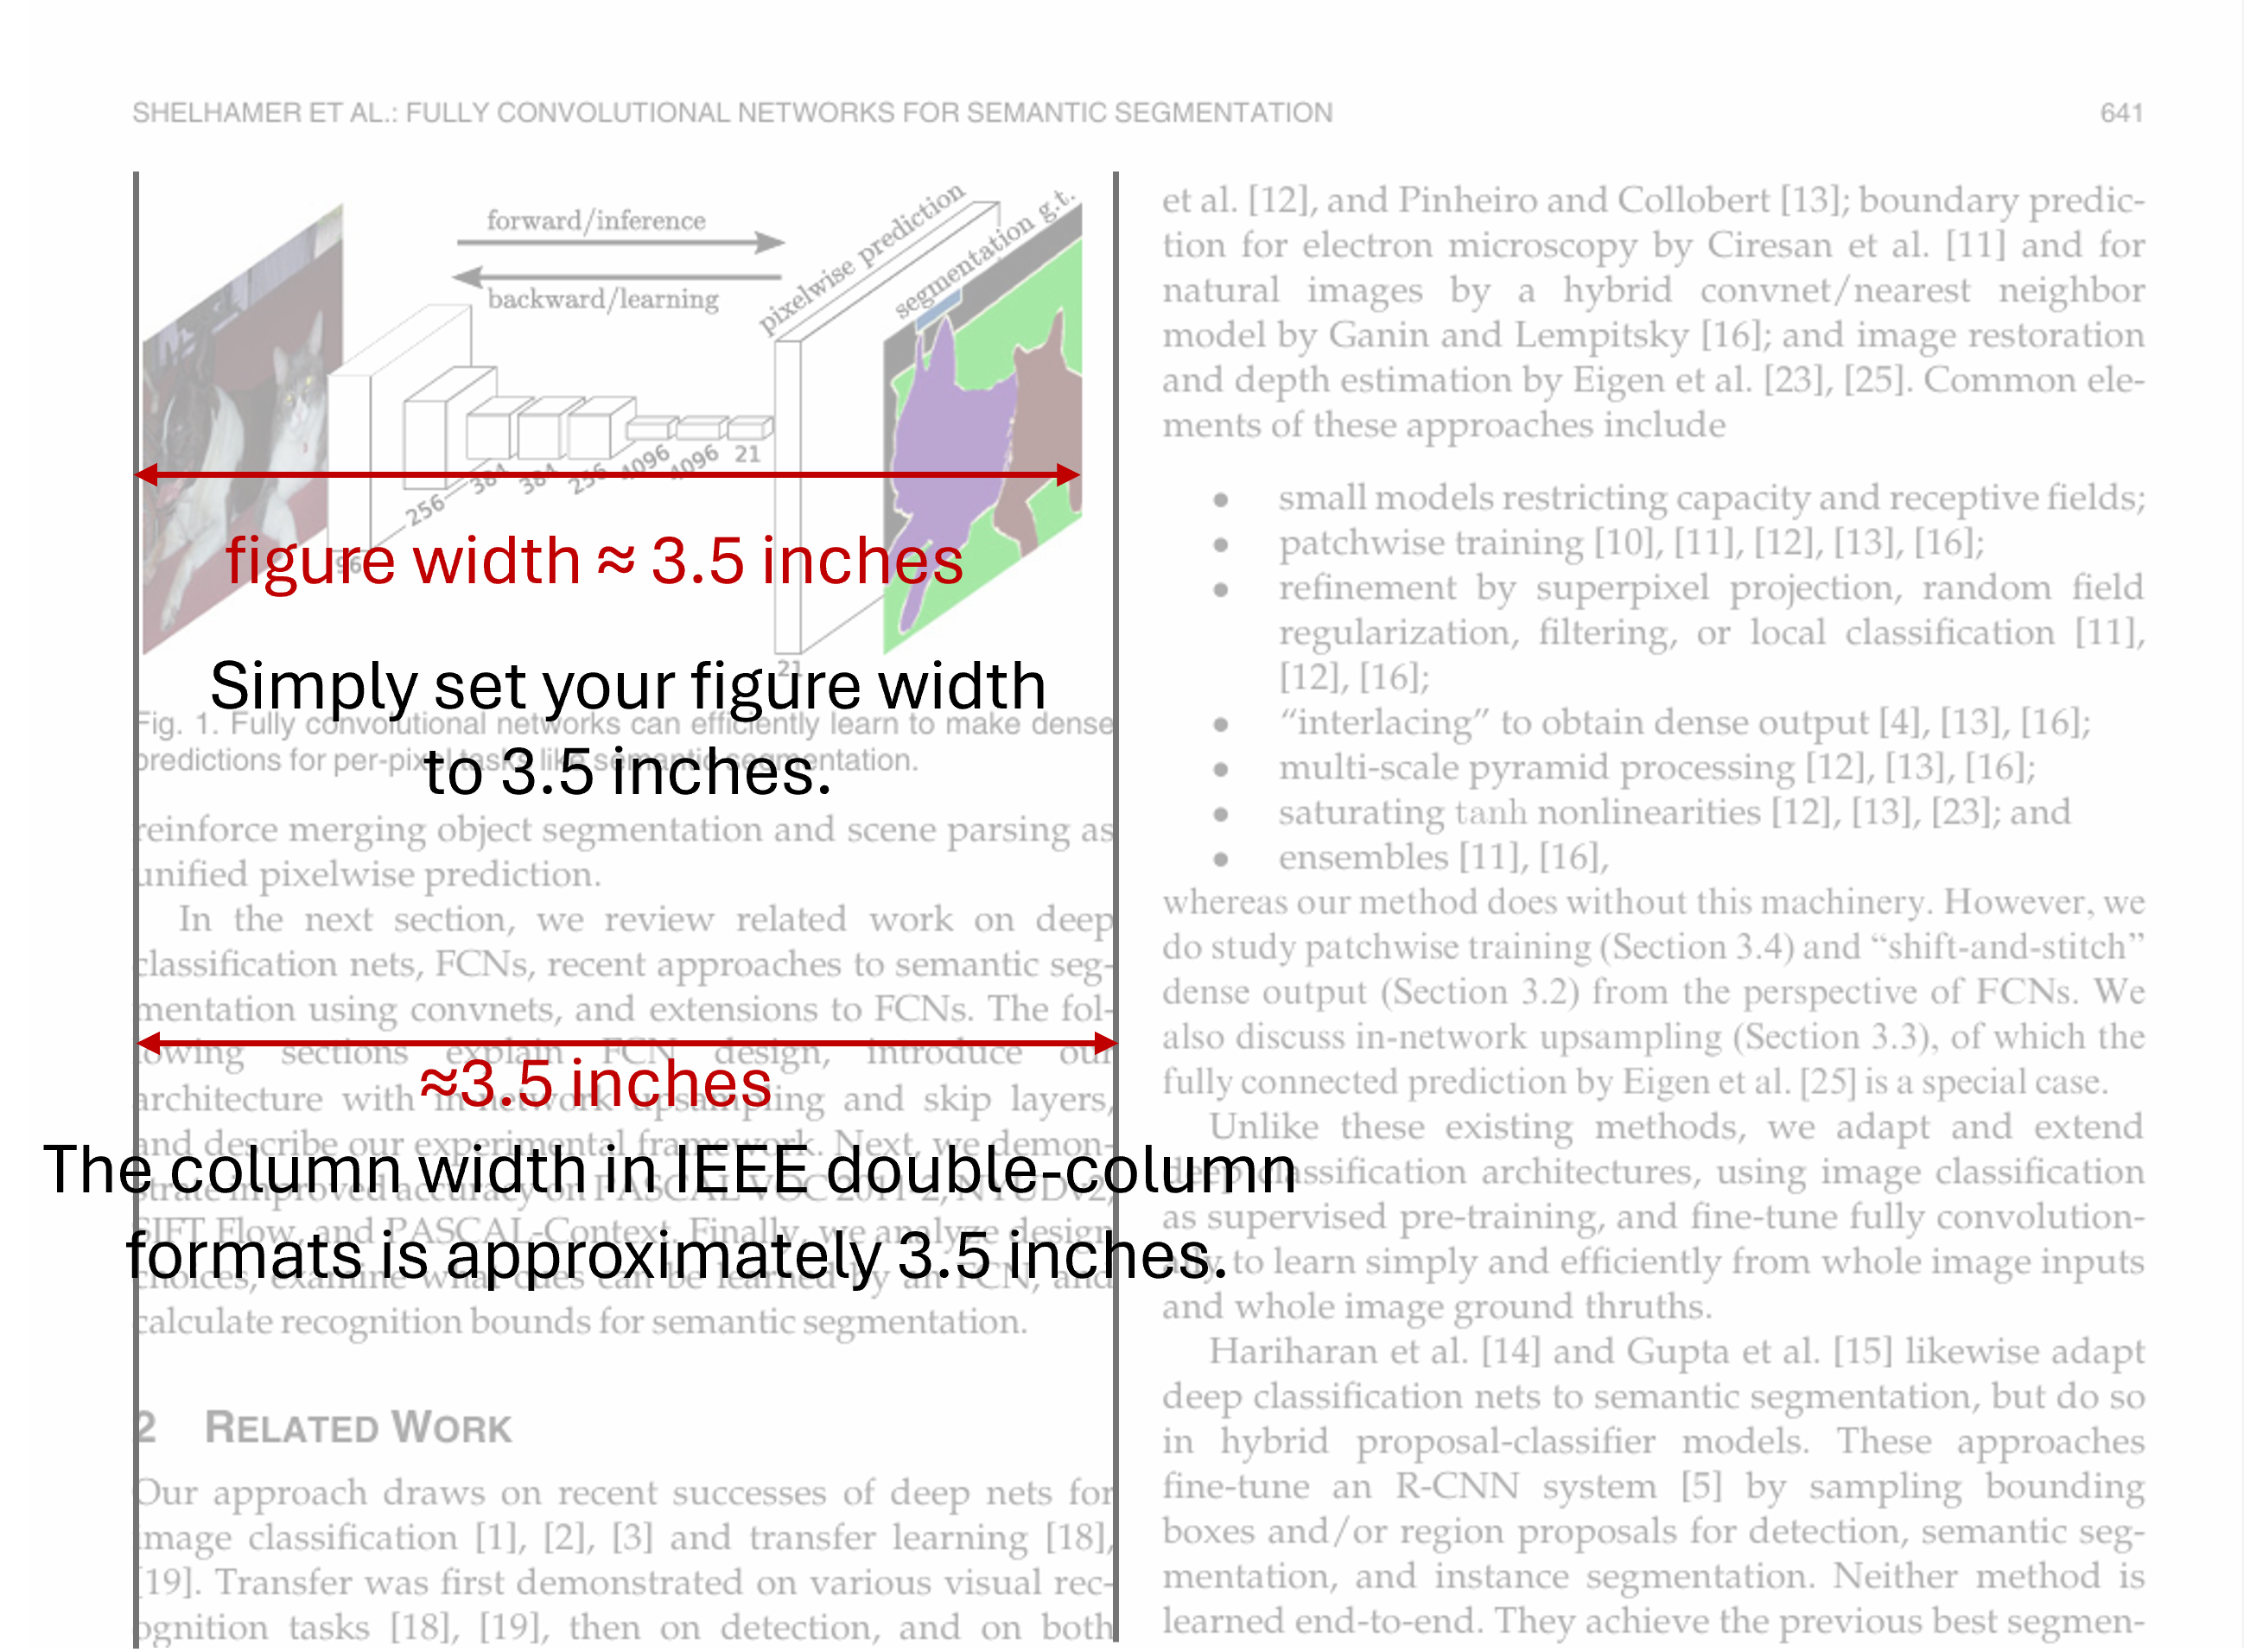
Column width in a double-column IEEE format is approximately 3.5 inches.
- Set the figure width to match the witdh of the figure in the document. In a double-column IEEE-style layout, the column width is typically 3.5 inches. Therefore, for a single-column figure, set the figure width to 3.5 inches.
fig = plt.figure(figsize=(3.5, 3.5))
- Set the font size to the default
import matplotlib as mpl
mpl.rcParams.update({
    "font.size": 10,
    "axes.labelsize": 10,
    "axes.titlesize": 10,
    "figure.titlesize": 10,
    "legend.fontsize": 9,
    "xtick.labelsize": 9,
    "ytick.labelsize": 9,
})
That’s it—the text in the figure will now be consistent with the main document.
📊 Precise Control of Matplotlib Legends
Legend is an essential component of a Matplotlib axis, used to identify and differentiate various elements within a plot.
A legend is generated by ax.legend() or plt.legend() function.
This section demonstrates several arguments for these functions
that allow precise control over the legend's appearance.
Legend Location: loc
Use legend(loc=) to specify the location of the legend.
Can be either accurate coordinates or string.
For example: ax.legend(loc=(0, 0.5)) or ax.legend("upper left").
fig, axes = plt.subplots(1, 3, figsize=(8, 3))
for i, ax in enumerate(axes):
    ax.set_ylim(-2, 1.1)
    for y in ys:
        axes[i].plot(x, y)
    axes[i].legend([f"i={i}" for i in range(5)], loc=(i/3, i/3))
plt.tight_layout()

Legend at different locations.
Font size: fontsize
Use legend(fontsize=) to specify the font size.
fig, axes = plt.subplots(1, 3, figsize=(8, 3))

for i, ax in enumerate(axes):
    ax.set_ylim(-2, 1.1)
    for y in ys:
        axes[i].plot(x, y)
    axes[i].legend([f"i={i}" for i in range(5)], loc=(0, 0), fontsize=8+i*3)
plt.tight_layout()

Legend with various font sizes.
Number of Columns: ncol
fig, axes = plt.subplots(1, 3, figsize=(8, 3))
for i, ax in enumerate(axes):
    ax.set_ylim(-2, 1.1)
    for y in ys:
        axes[i].plot(x, y)
    axes[i].legend([f"i={i}" for i in range(5)], loc=(0, 0), ncol=i+1)
plt.tight_layout()

Legends of different columns.
Row spacing: labelspacing
fig, axes = plt.subplots(1, 3, figsize=(8, 3))
for i, ax in enumerate(axes):
    ax.set_ylim(-2, 1.1)
    for y in ys:
        axes[i].plot(x, y)
    axes[i].legend([f"i={i}" for i in range(5)], loc=(0, 0), ncol=2, labelspacing=2*i)
plt.tight_layout()

Adjust the spacing between columns.
Column Spacing: columnspacing
fig, axes = plt.subplots(1, 3, figsize=(8, 3))
for i, ax in enumerate(axes):
    ax.set_ylim(-2, 1.1)
    for y in ys:
        axes[i].plot(x, y)
    axes[i].legend([f"i={i}" for i in range(5)], loc=(0, 0), ncol=2, columnspacing=2*i)
plt.tight_layout()

Adjust the spacing between columns.
Handle Length: handlelength
fig, axes = plt.subplots(1, 3, figsize=(8, 3))
for i, ax in enumerate(axes):
    ax.set_ylim(-2, 1.1)
    for y in ys:
        axes[i].plot(x, y)
    axes[i].legend([f"i={i}" for i in range(5)], loc=(0, 0), ncol=2, handlelength=i+1)
plt.tight_layout()

Adjust handle length.
Space Between Handle and Text: handletextpad
fig, axes = plt.subplots(1, 3, figsize=(8, 3))
for i, ax in enumerate(axes):
    ax.set_ylim(-2, 1.1)
    for y in ys:
        axes[i].plot(x, y)
    axes[i].legend([f"i={i}" for i in range(5)], loc=(0, 0), ncol=2, handletextpad=i)
plt.tight_layout()

Space between handle and text.